Is a 2014 Global Temperature Record Significant?
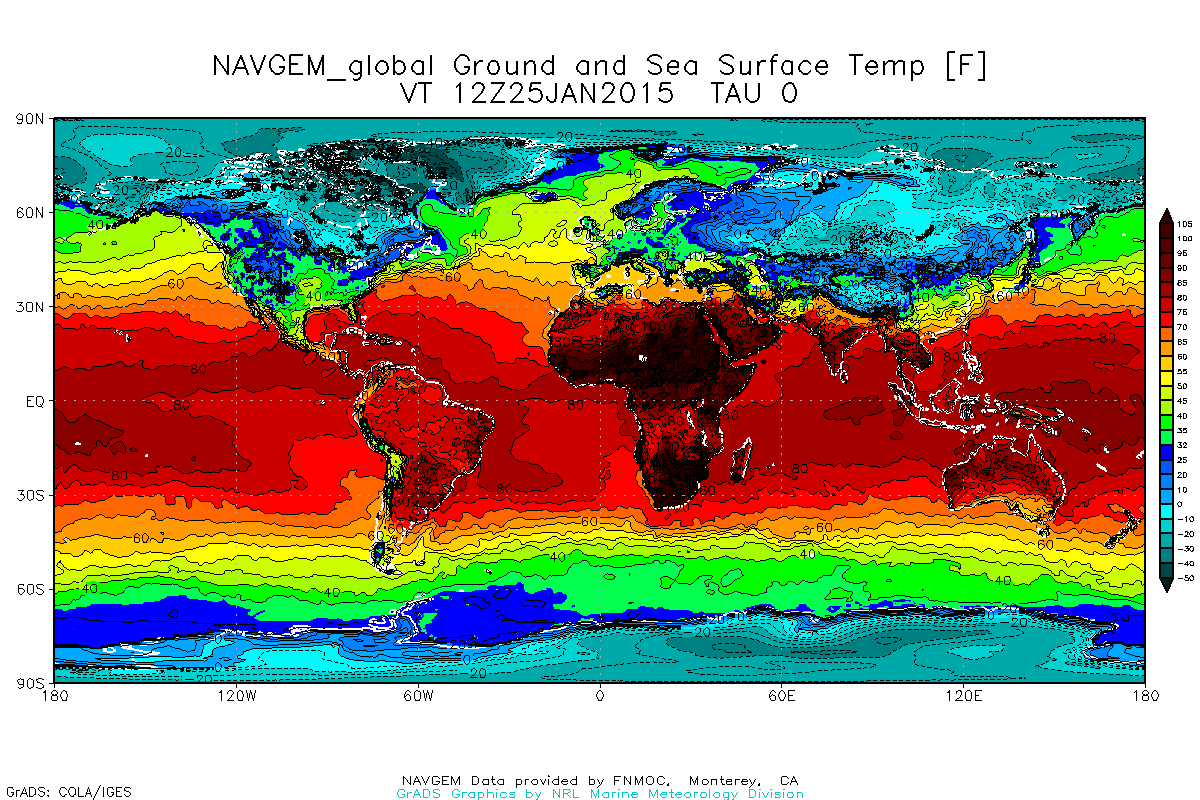
The media have gotten the message out big time: the 2014 global temperature was a record high (here’s the Huffington Post version and AP articles, but you can find the story everywhere).
There have been three valid criticisms of the record temperature claim:
- it’s widely agreed that the the earth has been warmer in the past, so this is only a record during the period of recorded temperature, which starts at 1880 (in fact some are saying that 2014 was in the coldest 3% of the past 10,000 years).
- among different organizations that publish temperature series, only two of them, NOAA and NASA, show that 2014 was the highest among recent years (Mike Smith).
- NOAA has a low confidence level in their own claim that 2014 temperature was a record (Daily Mail article, WUWT)
I’d like to put these aside and focus on a higher level question: Even if 2014 was a record, is that significant? Specifically, are these rare events, or are they commonplace?
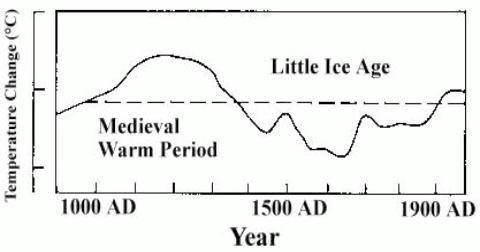
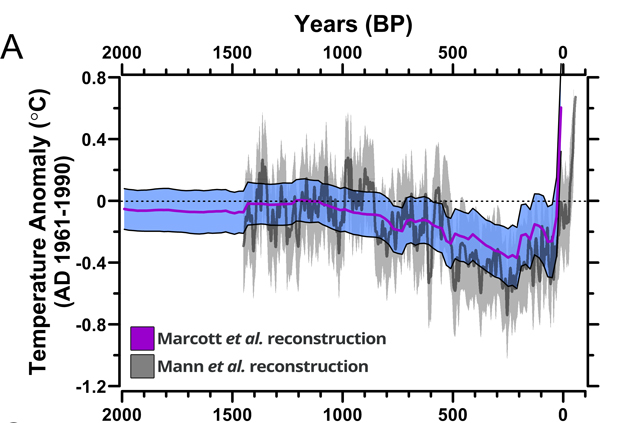
The estimated temperature of the last thousand years provides important context for understanding record highs. The two charts above show the original IPCC 1 chart and one of the more recent versions which downplay the Midieval Warming Period (example here). In either case the current warming trend that started with the Little Ice Age is obvious.
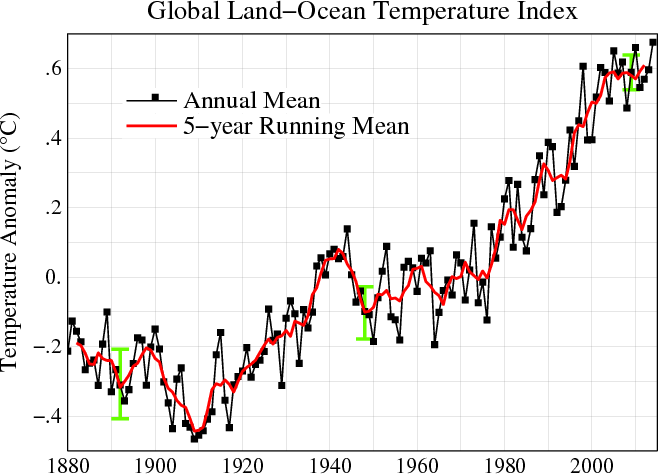
During this period, extending well before the start of the NASA and NOAA temperature record in 1880, the temperature trend has been steadily up, though individual years and decades were sometimes flat or slightly down. As the chart below from NASA shows, since 1880 there have been four distinct roughly 30 year periods:
- slightly down (1880-1910)
- steady increases (1910-1940)
- flat (1940-1970)
- steady increases (1970-2000)
Finally, the last 15+ years have been generally flat, having plateaued near the high established in 1997.
Think about it: if you start measuring something and it generally goes up, you’re going to frequently get record highs. And that’s exactly what we have in the NASA and NOAA temperature histories, which each have 18 records in their 134 year histories, a record every 7 years or so on average. The charts below show the number of records per decade starting at 1880 and working forward (note: I did the same experiment starting in 2014 and working backward in case there was something about the start date that inadvertently skewed the accumulated data, but it looked the same).
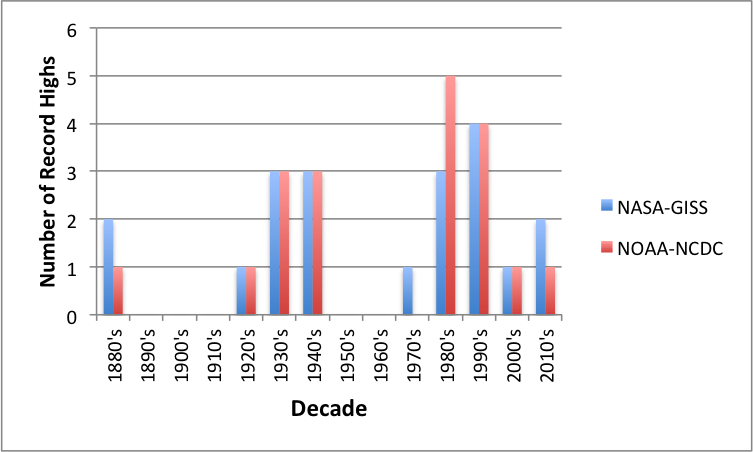
As you can easily see, high temperature records are commonplace since 1880, with many prior to the period of CO2 increases (that’s not to say that CO2 isn’t helping increase the temperature, just that records can happen regularly without elevated levels). In addition, the frequency of recent records doesn’t appear to be unique.
My conclusion is that the recent claims of high temperature add nothing to the data behind the current temperature run-up, which extends back into the 1700’s. If there was a record high in 2014, the fact that it happened is totally consistent with other record highs in the NOAA and NASA’s data.
Note: here’s a spreadsheet with the NOAA and NASA global land-ocean data in one place, and the records calculated. Note that a second tab has the land-only data.
